


The Official Definition You Probably Haven’t Read
Forecasts issued by the National Weather Service routinely include a “PoP” (Probability of Precipitation) statement, and the PoP simply describes the probability that the forecast grid point in question will receive at least 0.01 inches of rain. That threshold sounds arbitrary but it’s actually quite deliberate.
That threshold is deliberately tiny. It is the smallest amount a standard gauge can reliably measure, so the number is answering a much smaller question than most people assume: will anything measurable land here at all.
According to the NWS, the probability of precipitation is one of the most misunderstood elements of weather forecasts. That’s not a small admission from the agency that publishes the number every day for every city in the country.
It Is Not About Time

A 40% chance of rain doesn’t mean it rains 40% of the time. That is the real National Weather Service definition of Probability of Precipitation. The percentage has nothing to do with how many hours of your day will be wet.
A 40% chance spread across twelve hours and a 40% chance concentrated in a twenty-minute window at half past four are the same number and completely different days. The figure you see on your phone collapses all of that into one digit.
The number does not tell you how long. Duration is not an input to the calculation. That is the part most people never realize they are missing.
It Is Not About Coverage Either

In simple words, the PoP describes how likely it is for a measurable amount of rain to occur at any given point in the forecast area. It does not indicate the percentage of an area to be affected by rain, as some social media users have claimed.
The phrase most people miss is “any given point.” When you see 40%, the forecast is telling you about your specific location, not the region as a whole. Your street, your park, your outdoor wedding venue, specifically.
On a summer afternoon with scattered thunderstorms, one neighborhood can get soaked while the next stays bone dry. PoP folds both the forecaster’s confidence and that patchy coverage into a single number. That compression is useful and, at the same time, genuinely misleading.
The Formula Behind the Number

The NWS describes PoP with a simple equation: PoP = C × A, where C is the forecaster’s confidence that precipitation will occur somewhere in the area, and A is the percent of the area expected to receive measurable precipitation if it occurs at all.
If there is an 80% certainty of rain covering 50% of the area, that results in a 40% chance of rain. So two very different weather situations can produce the exact same number on your screen.
If the meteorologist is 40% sure that rain will develop in 100% of the area, that is also a 40% chance of rain. Identical outputs, completely different skies. That duality is worth keeping in mind before you cancel a picnic.
Intensity Is Not Part of the Equation
The percentage chance of rain does not tell you anything about its duration or intensity. This trips up even frequent weather-watchers, because intensity is often what actually matters for practical decisions.
A 90% chance can mean a light drizzle that clears in an hour, while a 30% chance can be tied to a brief but violent thunderstorm dumping an inch in fifteen minutes. The number tells you whether to expect rain, not whether to worry about flooding.
PoP says nothing about how much rain will fall. A 90% chance of rain could mean a brief shower. A 30% chance could mean a heavy thunderstorm if the conditions align. For rainfall amounts, look for the precipitation totals that better weather apps and the National Weather Service provide alongside the PoP.
How Forecasters Actually Calculate It
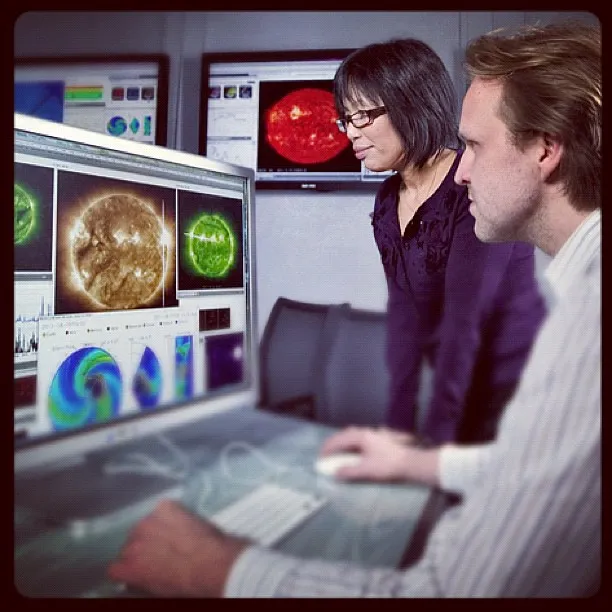
Meteorologists calculate the chance of rain by combining various factors, such as historical data, forecaster confidence, weather patterns, and probability models. Today, weather stations use radar technology to provide even better accuracy and more sophisticated observations.
Modern meteorologists run the model many times with slightly varied starting conditions and compare the results. This is called ensemble forecasting. It is essentially a way of honestly accounting for the fact that the atmosphere is chaotic and no single simulation can be fully trusted.
The probability statements you see in weather apps, like a 70% chance of rain, often come directly from ensemble output. If 35 of 50 ensemble members produce rain at your location, you get a 70% probability. The math is relatively transparent once you see it.
The Time Window Always Matters
The PoP measure is meaningless unless it is associated with an interval of time. Forecasts commonly use PoP defined over 12-hour periods, though 6-hour periods and other measures are also published. A “daytime” PoP12 means from 6 am to 6 pm.
The NWS typically issues probabilities for 12-hour periods, 6-hour periods, and hourly predictions. The longer the time period, the higher the chance that precipitation might occur at some point during that period. A 40% figure tied to a full day is a very different thing from a 40% figure tied to the hour you plan to go for a run.
The specified period of time may range from 1 to 12 hours. Always check which window the number is covering before you decide it’s irrelevant to your afternoon plans.
How Accurate Are These Forecasts, Really?

Modern forecast accuracy is higher than most people realize. Five-day forecasts are accurate about 90% of the time, seven-day forecasts about 80%, and 10-day forecasts about 50%. Useful skill drops off beyond two weeks because of the butterfly effect, where tiny errors in initial conditions compound into large errors over time.
By comparing the different ensemble members, forecasters can assess the likelihood of specific events. If the forecasts vary widely, it indicates a high level of uncertainty; if they are similar, confidence in the prediction increases. A tight cluster of model runs behind your 40% figure is a very different thing from a widely scattered one.
If most of the runs agree, confidence is high. If they diverge, the forecaster knows uncertainty is high and can communicate that to the public. The single percentage you see is a summary of all that complexity, for better or worse.
Common Myths, Cleared Up
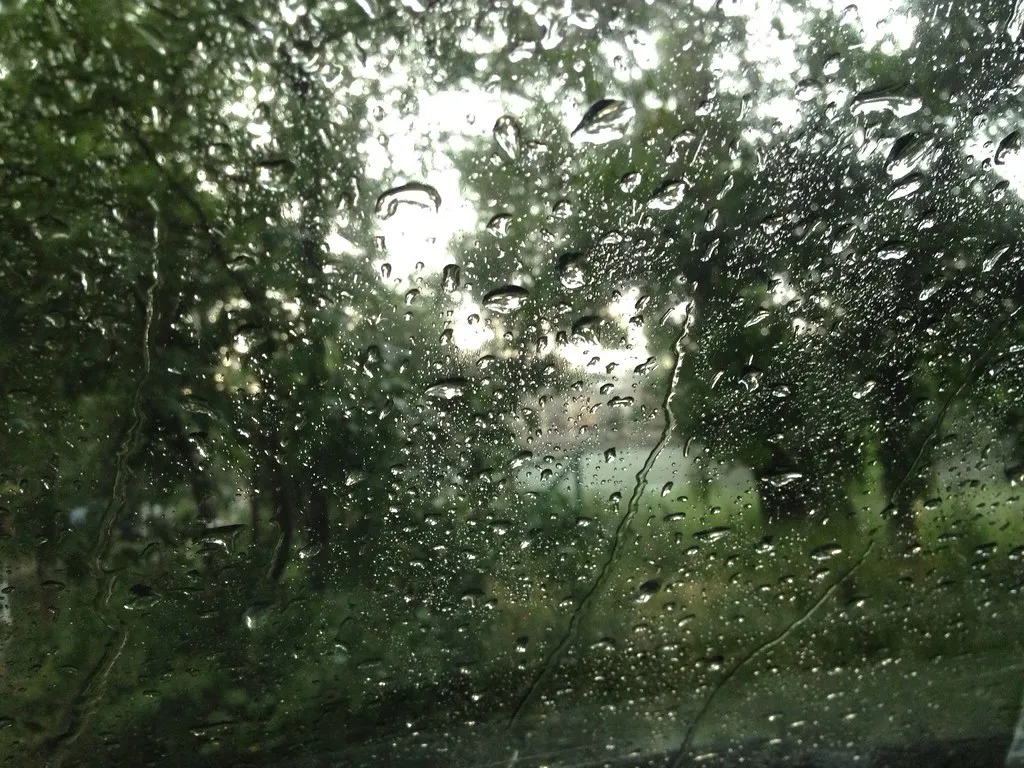
Most people assume that a 40% chance of rain means it is going to rain 40% of the day, but that thought process is not correct. That assumption is probably the most widespread misreading in everyday weather consumption.
Ask ten people what a 40% chance of rain means and you will get at least three answers: it rains 40% of the day, it rains on 40% of the area, or there is a 40% chance of getting wet at some point. Only the last one is close, and it is still not quite it.
The percentage does not mean 40% of the area will have rain at a given time, nor does it indicate rain intensity or duration. Three separate misconceptions in one sentence, which tells you something about how layered the confusion actually is.
How to Actually Use This Number

The PoP number is a probability, which means it tells you the odds, not the outcome. A 70% chance of rain means rain is more likely than not. A 20% chance means rain is unlikely but not out of the question.
The honest reading of a 40% chance of rain is something like: rain is plausible today, nobody can promise you either way, and this number is not going to help you decide whether to cancel anything. Harsh, but fair.
The mistake is only ever using it for a decision it was never built to answer. At nine in the morning, “40% today” is fine. At three in the afternoon, with the sky going dark and a plan to keep or break, you want a time, not a percentage. Pair PoP with hourly forecasts and radar when it actually counts.
The Takeaway
Weather apps have made forecast data more accessible than at any point in history, but the numbers inside them are only as useful as your ability to read them correctly. A 40% chance of rain is a probability about your specific location, during a specific time window, crossing a very low precipitation threshold. It says nothing about how hard, how long, or how much.
The next time you see that number, the most useful question isn’t “will it rain?” It’s closer to “when, and for how long?” Check the hourly breakdown and the precipitation totals alongside PoP, and you’ll have a far more practical picture of what the sky is actually planning to do.
AI Disclaimer: This article was created with the assistance of AI tools and reviewed by a human editor.